Quick Download Links
Updates
Dec 31, 2013
Available Data
EC stations data is the basic information of all EC climate stations. It’s available in three formats.
- CSV, which has following columns: ID, NAME, PROVINCE, LATITUDE, LONGITUDE, ELEVATION. The ID column is the station ID required in ECReader .
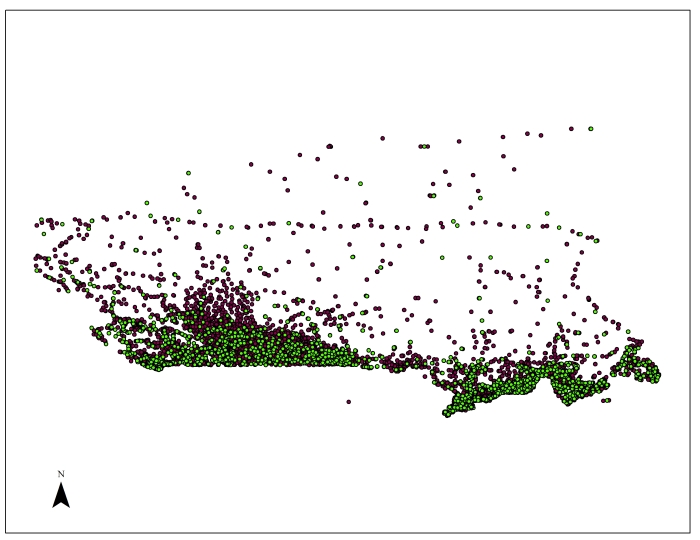
- Shapefile, which is created from the CSV file with “Add XY Data” tool in ArcMap. Geographic coordinate system (GCS_North_American_1983) is used. The columns are same with CSV file.
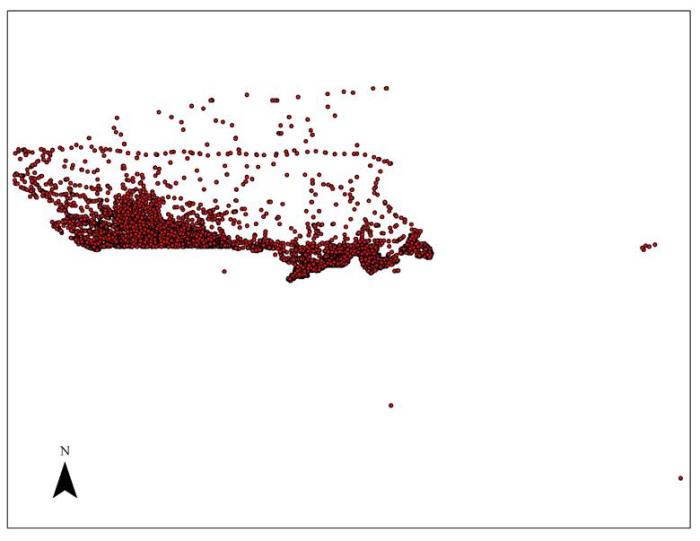
Please note that the 5 stations in the right bottom corner has missing latitude and longitude in the Environment Canada website. In the data here, the latitude and longitude is set as 0.
- KMZ, which is converted from shapefile with “Layer To KML” tool in ArcGIS. It’s intent to be used in Google Earth for further analysis.

A zip file, which contains all these three formats, is also available.
Calculation of Latitude and Longitude
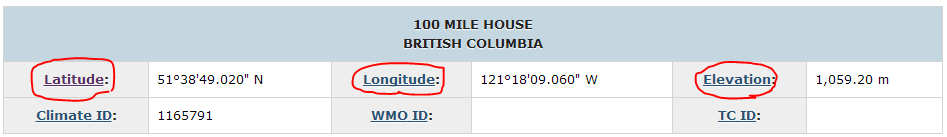
Latitude and longitude is calculated based on information given in the daily data report page. The degree, minute and second format displayed on the page is converted to decimal degree using following equation.
Decimal Degree = Degree + (minute + second/60.0) / 60.0
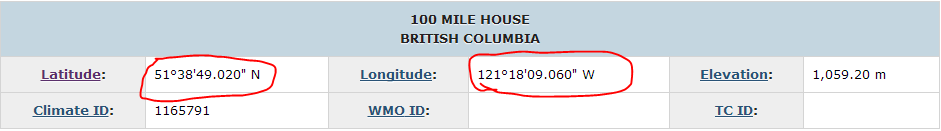
For climate station 100 Mile House in BC,
Latitude = 51 + (38 + 49.2/60)/60 = 51.64695
Longitude = 121+ (18 + 9.06/60) 60 = 121.302516666667 (saved as -121.302516666667)
Steps Implemented in ECReader to Generate the CSV File
-
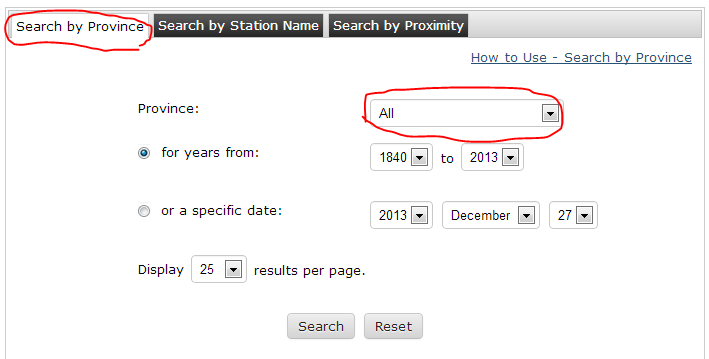
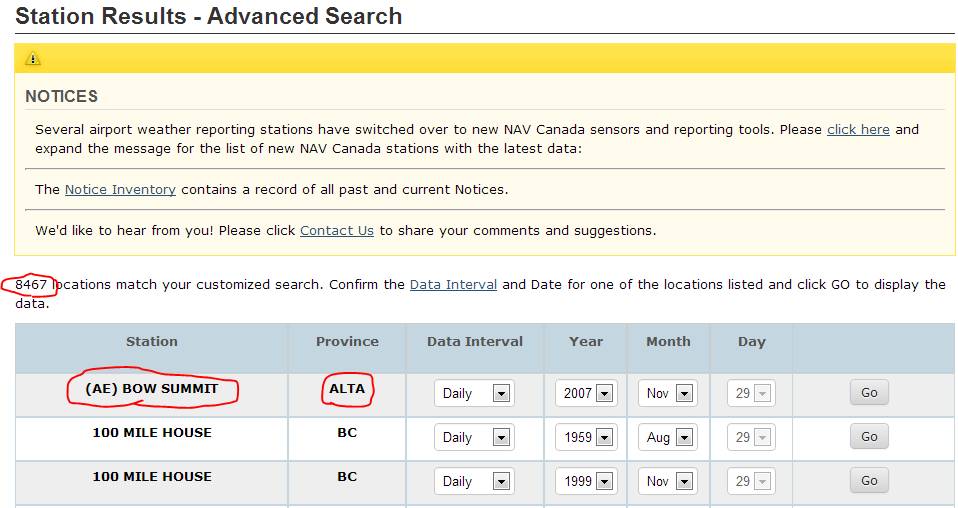
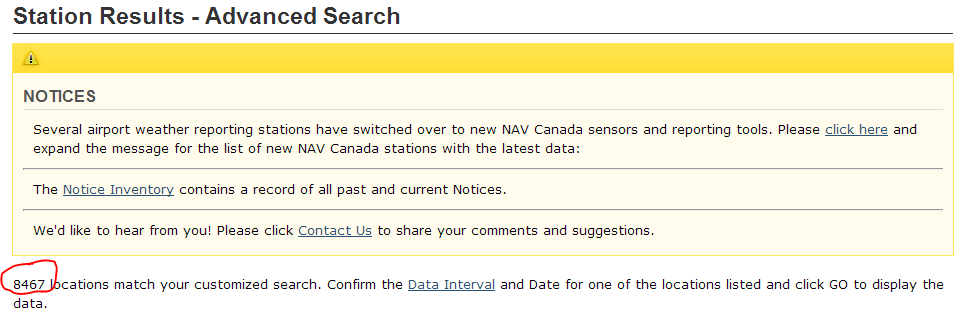
Get all stations using “Search by Province” in Advance Search. 8467 stations are displayed in several pages. In each page, read station ID, station name, province and available data type (hourly, daily and monthly) and corresponding time period of each station. The station ID and available data type is save as hidden input in the result page.
- For each station, go to the daily report page and read latitude, longitude and elevation.
-
For each station, write station ID, name, province, latitude, longitude and elevation into the CSV file. More information is available.
These steps are implemented in ECReader as simple as clicking a button. Please note that this button is not added to the interface for performance consideration. In case you want to test this function yourself, please reply at the bottom of this blog.
Background
When a SWAT model is setup, it would be convenient if the location of all EC climate stations is available in some GIS formats, which could be used to determine which stations should be used in the model.
EC doesn’t give this map. Instead, a tool is supplied in the Advanced Search to help locate stations. It’s not good enough for GISers, who wants to work in a more visual way. I’m that guy.

Google internet, a shapefile is found here. Interestingly, it happens to be created by University of Guelph, where I worked for three years starting from 2010. I was in Department of Geography, which also should be where the data come from. I could know the professor or student who created this data. Anyway, this data is just meant to handle stations with climate normals and there are 1480 stations compared to 8467 stations got from advance search in EC website. Apparently, we couldn’t use this data for the modelling work.

Solution
EC give the location (latitude and longitude) of each station in the daily data report page. Retrieving this page for all 8467 stations and then reading the location from the page would be a perfect solution for computers.

At the same time, it’s possible to get the station ID required in ECReader and create a simple lookup relation between station name and station ID, which means user won’t need to find the station ID themselves as before. ECReader would be more friendly.
Implementation
ECReader is modified to do this work. The response from EC website is in html format. To read this, System.Xml.XmlDocument is first used. It didn’t work well on parsing html. Exceptions everywhere. Then, 3rd party library HtmlAgilityPack was found and it was perfect.
The process is implemented as a static method of class EC. It saves all the information in CSV format. To get all the stations, depends on the computer configuration, half an hour is needed.
The final data is compared with data generated by University of Guelph. All the stations are in the same location.
Future Work
There are several ways to utilize the station data in ECReader in the future development.
- Lookup station ID from station name. No one want to get station ID himself.
- Add more methods to define working stations, including the interactive map selection (import watershed boundary or select manually on the map) which could be implemented with DotSpatial.
